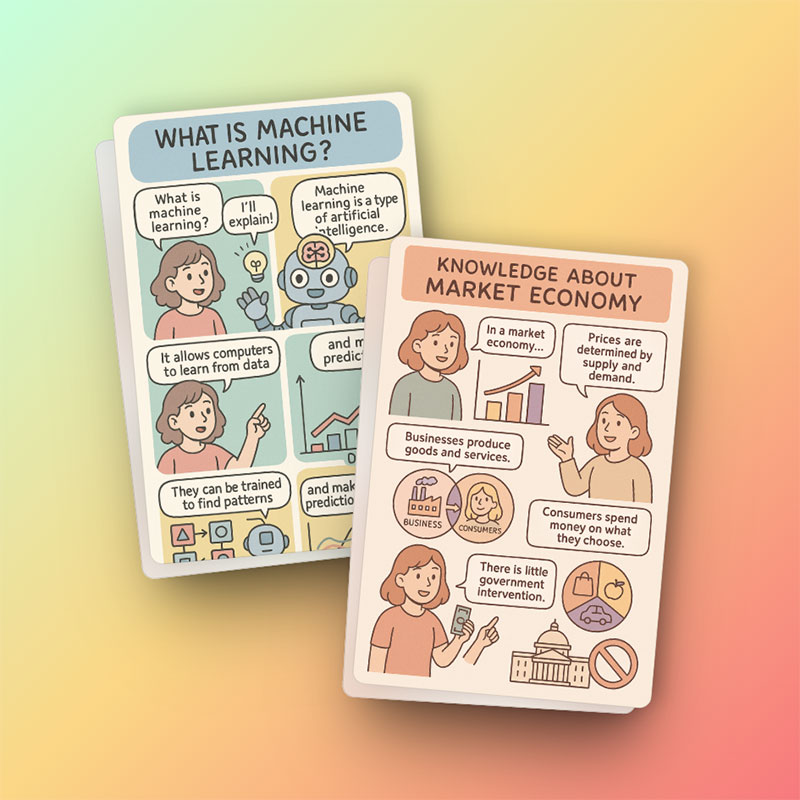
Infographic Comic Creator
Transform complex information into engaging visual narratives with our AI-powered infographic comic generator. Perfect for education, presentations, and making data accessible and memorable.

What is Infographic Comic Generator
Our infographic comic generator combines the storytelling power of comics with the explanatory clarity of infographics. Traditional infographic creation requires extensive design skills and time, but our AI tool makes it accessible to everyone. Simply describe the information you want to visualize, and watch as AI transforms complex concepts into visually engaging, easy-to-understand comic-style infographics.
- Visualize Complex DataTransform statistics, processes, and complex ideas into visually appealing and easy-to-understand graphics with narrative elements.
- Customizable StylesChoose from various color schemes and stylistic approaches to match your brand identity or topic requirements.
- Multi-Language SupportGenerate infographic comics in multiple languages including English, Chinese, Japanese, Korean, Spanish, French, and German.
Understanding Infographic Comics
What Are Infographic Comics?
Infographic comics blend visual data representation with comic-style storytelling to create engaging educational content. This hybrid format uses comic elements like characters, speech bubbles, and sequential panels alongside traditional infographic components such as charts, diagrams, and data visualization. The result is content that explains complex information through narrative, making it more accessible, engaging, and memorable than either format alone.
Uses and Applications
Infographic comics excel in educational contexts, explaining complex processes, presenting research findings, creating engaging marketing materials, and simplifying technical documentation. They're particularly effective for presenting dry or complex information in a way that captures attention and improves retention. Organizations use them for internal communications, annual reports, and social media content that needs to communicate data-driven insights.
Creating Effective Infographic Comics
Effective infographic comics balance data accuracy with storytelling elements. They present information in a logical flow, use consistent visual language, incorporate relevant characters or scenarios to contextualize data, and maintain visual clarity with appropriate typography and color schemes. Our AI generator handles these design principles automatically while allowing you to focus on the content and message.
AI-Powered Infographic Creation
Our AI generator revolutionizes infographic comic creation by understanding both data visualization principles and comic storytelling techniques. It analyzes your descriptive prompt, identifies key information points, and automatically generates an infographic comic that presents your data in a visually compelling and narratively engaging format—all without requiring design skills or specialized software.
Customization Options
Our generator offers various customization options including different color schemes (warm, cool, soft, vibrant, pastel, or monochrome), layout variations, and stylistic approaches. You can also influence the design by specifying the tone, complexity level, and target audience in your prompt. This flexibility ensures your infographic comic perfectly matches your communication goals and brand identity.
Frequently Asked Questions About Infographic Comics
Have another question? Contact us by email.
How does the infographic comic generator work?
Our generator uses advanced AI to transform your text description into a visual infographic with comic elements. Simply describe the data or concept you want to visualize, provide any specific style preferences, and the AI will create an infographic comic that presents your information in an engaging, visually appealing format.
Do I need design skills to use this tool?
No design skills are required. Our AI handles all the visual design aspects, including layout, color scheme selection, chart creation, and character illustration. You only need to describe the information you want to present, and the AI will handle the visual implementation.
What languages are supported?
The tool supports multiple languages including English, Chinese, Japanese, Korean, Spanish, French, and German. You can create infographic comics in any of these languages, and the AI will generate appropriate visuals and text placement.
Can I use the infographic comics commercially?
Yes, all infographic comics generated with our tool can be used for both personal and commercial purposes, depending on your subscription plan. You retain full rights to the infographics you create.
What types of data can I visualize?
Our tool can handle various data types including statistics, processes, timelines, comparisons, hierarchies, geographic data, and conceptual information. The AI automatically selects the most appropriate visualization method (charts, diagrams, illustrations) based on your data type to ensure optimal clarity and engagement.
How long does it take to generate an infographic comic?
Most infographic comics are generated within 30-60 seconds, depending on the complexity of your data and current server load. The system processes your request as quickly as possible while ensuring high-quality results that effectively communicate your information.
What makes a good prompt for infographic comics?
Effective prompts should clearly describe the core information you want to visualize, the target audience, and your preferred tone (formal, casual, humorous). Include key data points, relationships you want to highlight, and any specific visual preferences. For example, 'Create an infographic comic explaining the water cycle for middle school students, including precipitation, evaporation, and condensation stages, with a friendly tone and ocean-inspired color scheme.'
How do infographic comics differ from regular infographics?
While traditional infographics focus primarily on data visualization with minimal narrative elements, infographic comics incorporate storytelling techniques, characters, and sequential panels to create a more engaging experience. Infographic comics often use metaphors, scenarios, and dialogue to contextualize information, making complex data more relatable and memorable.
Can I include my branding in the infographic comics?
Yes, you can specify brand colors, logo placement, and style guidelines in your prompt. The AI will incorporate these elements to create an infographic comic that aligns with your brand identity while effectively communicating your information.
What are the best uses for infographic comics?
Infographic comics excel at explaining complex processes, presenting statistics in context, breaking down technical concepts for non-experts, creating engaging educational content, and transforming dry data into compelling visual stories. They're particularly effective for social media content, educational materials, internal communications, and presentations where audience engagement is crucial.
Start Creating Amazing Infographic Comics Today
Transform complex information into engaging visual stories in seconds.
